Transport
Work Package lead: CLIMACT
The Expert consultation workshop on the decarbonization of transport in the EU took place in Vienna on Thursday 19 April. A brief summary of the workshop will be available soon. Workshop slides can be found below:
Introduction 180419_EU Calc – Intro Vienna Workshop (pdf, 528KB)
Overview of Transport Module 180419_EU-Calc_Transport_Module (pdf, 1.3MB)
Sustainability of Schiphol Group 180419_EU CALC_Sustainability Schiphol Group (pdf, 2.6 MB)
Module design
Calculation Flow & Input/ Output Matrix

The module design is described in a tree-like calculation flow and a matrix specifying interactions with other sectors or modules.
Data & Assumptions
Transport stock database by EU country and ambition level definition

Overview of the data collected, gathered and presented. Metadata is also provided.
Implementation
Timeline and progress documentation

A timeline and a flow visualization of the programmed module have been created to show progress and compare implementation to the module design
Your feedback and comments are much appreciated, questions will be addressed rapidly.
Module design
The scope of the transport module includes passenger transport and freight.
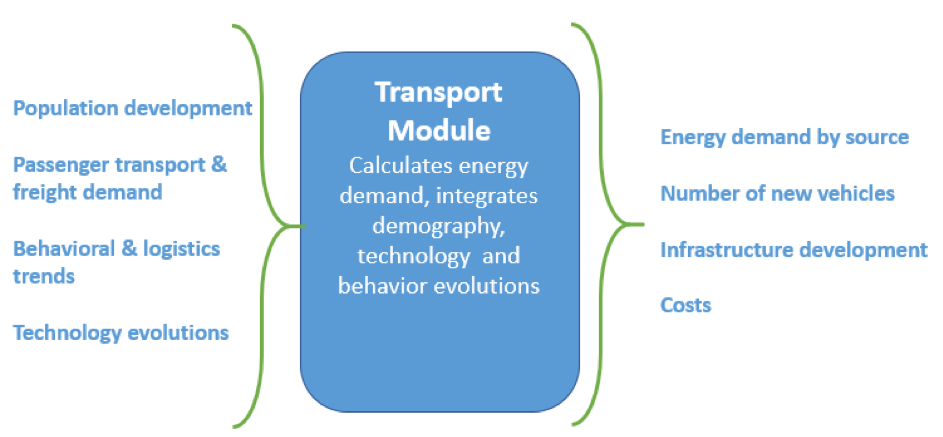
The goal of this module is to provide different outputs that will be used by other work package:
- The energy consumption of transport by source (fossil fuels, biofuels, electricity);
- The number of new vehicle sales (cars, trucks, buses, planes, boats, trains) and the need for new infrastructures (roads, rails, cables for electri-highways);
- The costs of the transport system (CAPEX and OPEX).
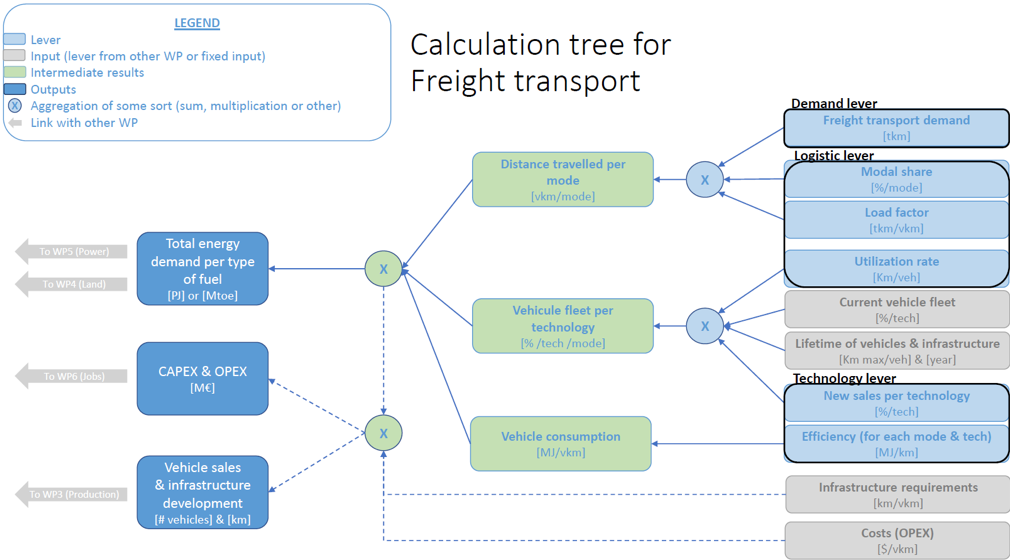
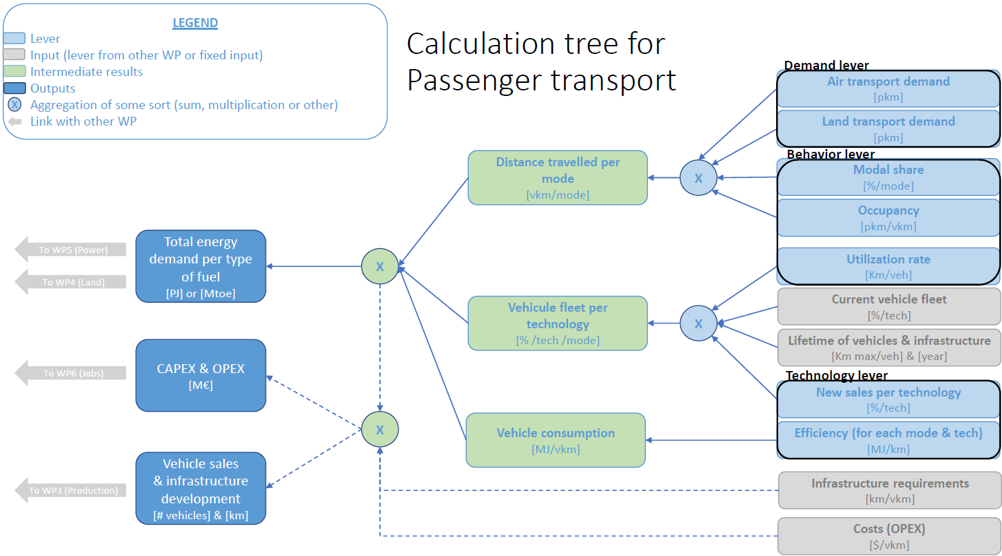
For each sub-module (passenger and freight), we have established 3 sets of levers:
| Passenger transport levers | Freight levers |
|
|
Calculation Trees (Passenger & Freight)


Inputs – Outputs

Data & Assumptions
Historical data: historical data for all levers and inputs are taken in priority from European databases and annual reports such as: Eurostat, EU-pocketbooks and EU-reference scenarios. If no data is available for one type of input, other sources are used such as TRACCS or ICCT.
Finally, if no data is found, the missing data is estimated either by interpolation or extrapolation if only a few years are missing, or by using a proxy indicator.
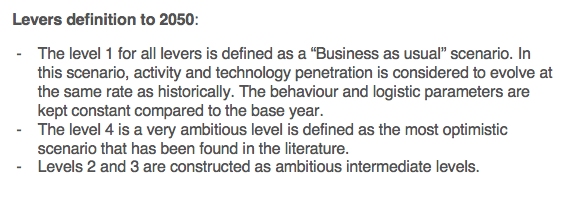
Levers definition to 2050:
- The level 1 for all levers is defined as a “Business as usual” scenario. In this scenario, activity and technology penetration is considered to evolve at the same rate as historically. The behaviour and logistic parameters are kept constant compared to the base year;
- The level 4 is a very ambitious level is defined as the most optimistic scenario that has been found in the literature;
- Levels 2 and 3 are constructed as ambitious intermediate levels.
Implementation
Timeline
The Transport work-package timeline is summarised in the figure below and highlights key milestones and expected outcomes.

The first version of the module calculates the energy consumption of the transport sector.
The second version is now under construction and will provide new vehicle sales, needs for new infrastructures, and yearly estimations for the transport system costs.
The expert consultation will be held on April 19 in Vienna as a side event to the TRA conference 2018.
Contact point
Contact for questions about the data and module: Emily Taylor et@climact.com
